Monday, May 9, 2011
Conclusion
Rouseff Fiscal Restraint--Cut Spending and Reduce High Real Interest Rate
"First, Brazil clearly went through a particularly acute case of the “political business cycle”, the well documented tendency for governments to ramp up spending before elections. The recent increases in big spending, first justified as an anti-cyclical, “Keynesian” response to the 2008 crisis, continued unabated even with economic growth topping 7 per cent a year. Now with the election won, there is no electoral reason to keep spending growth at the current level. The second unrecognized reality is that this spending surge is already causing serious imbalances in the economy. This can already be seen in very tight labor markets, surging imports, and continued high inflation for non-tradable items.
...
Fiscal restraint is the key element of a new economic “model” for Brazil, and although changing fiscal policy is always slow and difficult, the incentives to do so now are great. As Rousseff knows, an economic crisis is the one sure way to lose political power."
Tony Volpon of Nomura
Brazil + China = BFFs?

Leading exports to China include: iron ore, soybeans, and crude oil. The iron ore export represents 43% of Brazil's total exports to China.
Some problems are evident between this trade relationship; a large portion of Brazil's imports from China are manufactured products, set at low costs, which affect Brazil's domestic manufacturing industries (that are now struggling to keep up with this competition).
A few tariffs on synthetic fibres imports from China have been put in place by the government and President Dilma Rousseff.
Banking System
Wednesday, March 23, 2011
GDP: Brazil, United States, & China (in trillions)
| United States | China | Brazil | |
| 1990 | $5.76 | $0.36 | $0.46 |
| 1991 | $5.94 | $0.38 | $0.41 |
| 1992 | $6.29 | $0.42 | $0.39 |
| 1993 | $6.61 | $0.44 | $0.44 |
| 1994 | $7.03 | $0.56 | $0.55 |
| 1995 | $7.36 | $0.73 | $0.77 |
| 1996 | $7.78 | $0.86 | $0.84 |
| 1997 | $8.28 | $0.95 | $0.87 |
| 1998 | $8.74 | $1.02 | $0.84 |
| 1999 | $9.30 | $1.08 | $0.59 |
| 2000 | $9.90 | $1.20 | $0.64 |
| 2001 | $10.23 | $1.33 | $0.55 |
| 2002 | $10.59 | $1.45 | $0.50 |
| 2003 | $11.09 | $1.64 | $0.55 |
| 2004 | $11.81 | $1.93 | $0.66 |
| 2005 | $12.58 | $2.26 | $0.88 |
| 2006 | $13.34 | $2.71 | $1.09 |
| 2007 | $14.06 | $3.49 | $1.37 |
| 2008 | $14.37 | $4.55 | $1.64 |
| 2009 | $14.12 | $4.99 | $1.57 |
Thursday, March 10, 2011
Brazil posts fourth-quarter growth of 5% GDP may cool to 4.5%-5% range in 2011
Brazil's Market
Amazon Basin and Rainforrest Animals

SPIDER MONKEY

GIANT RIVER OTTER

CAPYBARA

TOUCAN

PINK RIVER DOLPHIN

ELECTRIC EEL

PIRANHA


ANACONDA
Thursday, March 3, 2011
Urban vs. Rural Life
Sociocultural Values
Political Structure
Demographics
Population201,103,330 Age structure0-14 years: 26.7% (male 27,092,880/female 26,062,244) Median agetotal: 28.9 years Population growth rate1.166% (2010 est.) Birth rate18.11 births/1,000 population (2010 est.) Death rate6.35 deaths/1,000 population (July 2010 est.) Net migration rate-0.09 migrant(s)/1,000 population (2010 est.) Urbanizationurban population: 86% of total population (2008) Sex ratioat birth: 1.05 male(s)/female Infant mortality ratetotal: 21.86 deaths/1,000 live births Life expectancy at birthtotal population: 72.26 years Total fertility rate2.19 children born/woman (2010 est.) Ethnic groupswhite 53.7%, mulatto (mixed white and black) 38.5%, black 6.2%, other (includes Japanese, Arab, Amerindian) 0.9%, unspecified 0.7% (2000 census) ReligionsRoman Catholic (nominal) 73.6%, Protestant 15.4%, Spiritualist 1.3%, Bantu/voodoo 0.3%, other 1.8%, unspecified 0.2%, none 7.4% (2000 census) LanguagesPortuguese (official and most widely spoken language); note - less common languages include Spanish (border areas and schools), German, Italian, Japanese, English, and a large number of minor Amerindian languages Literacydefinition: age 15 and over can read and write School life expectancy (primary to tertiary education)total: 14 years Education expenditures5.2% of GDP (2007) |
Wednesday, March 2, 2011
Brazilian History
Friday, February 25, 2011
Brazil's Top Imports and Exports

Monday, February 7, 2011
Brazil's Two Largest Cities
SAO PAULO
POPULATION: APPROX. 11.2 MILLION

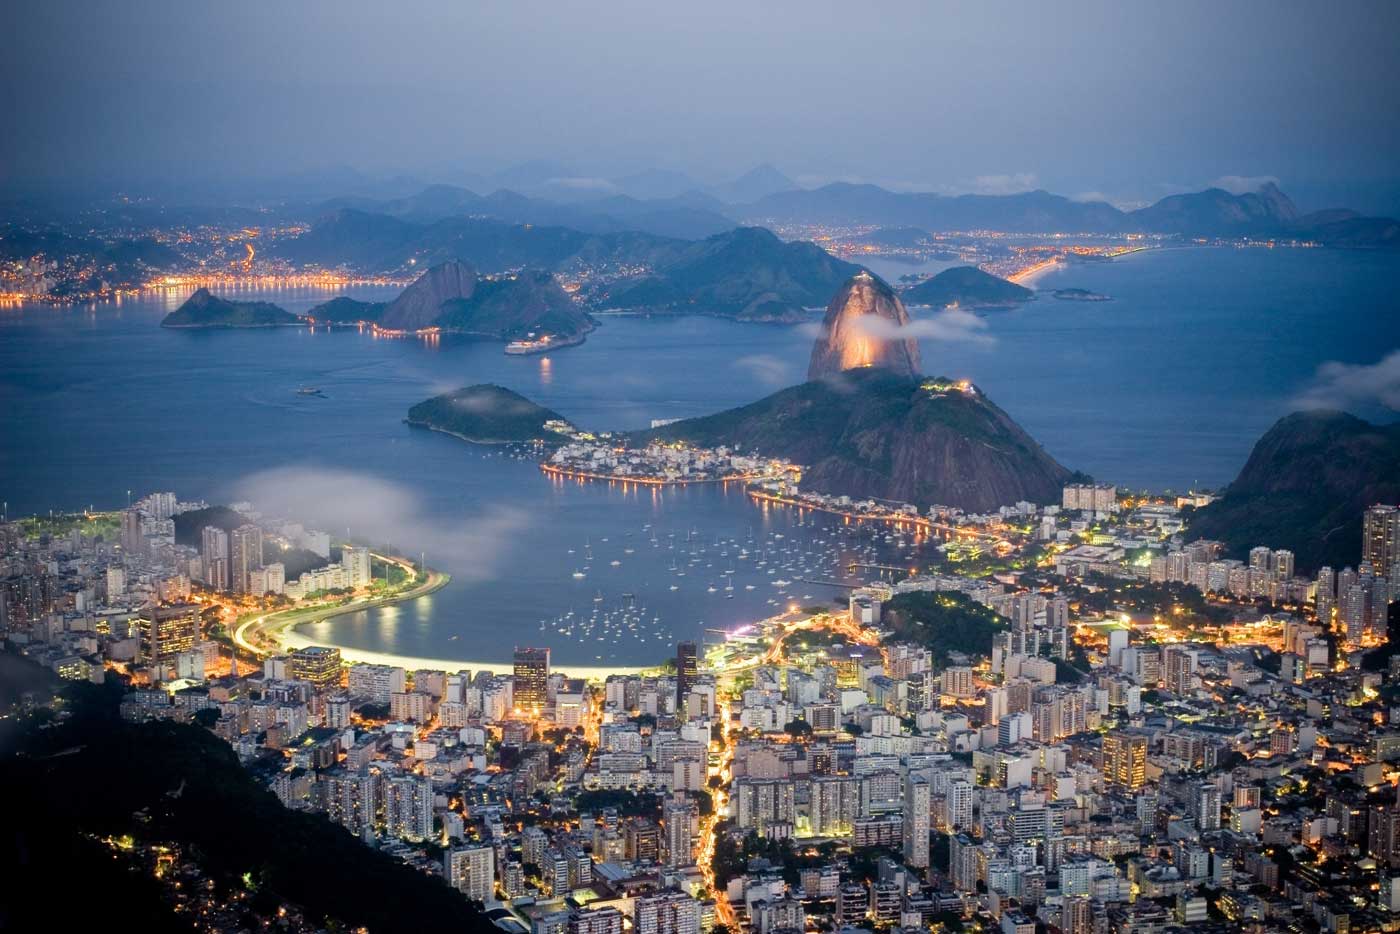
RIO DE JANEIRO
POPULATION: APPROX. 6.3 MILLION
